Hopefully the hours that you’ve spent in the workshop have been useful in getting started with ImageJ.
As pointed out at the beginning of the workshop, the aim was not to bombard you with a list of function after function of all of the filters, analyses, and pipelines that ImageJ has to offer, but rather to provide an environment for you to explore ImageJ at your own pace, with demonstrators at hand to help out when needed.
Nonetheless, you should now be relatively comformtable with the following simple operations and concepts
Now that you are familiar with the basics of ImageJ, the best way to improve and learn more is to practice!
In addition there is one further session on ImageJ macro editing where I will introduce how to edit the recorded macros to become more powerful, as well as showing how to write a macro from scratch!
Note
Some of the concepts related to editing macros overlap with general programming concepts; be prepared for a relatively steep learning curve if you are entirely unfamiliar with all programming concepts, as we won’t have time to cover these in the single workshop session!
As emphasised throughout the workshop, ideally you will have brought your own data to process, or have managed to find similar data from other sources (e.g. colleagues, online).
This is so that the techniques and skills you learn are those that are most relevant to your work.
However, if you were not able or for some other reason prefer not to work on such data, I have provided a handful of additional exercises below to practice your image processing skills on.
Download the sample data from
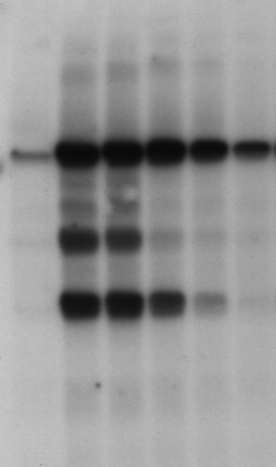
Typically such images are used as evidence of the presence or absence of macromolecules and their fragments (more info here for example: https://en.wikipedia.org/wiki/Gel_electrophoresis ).
Your task is to try and quantify the data in this image (e.g. quantitatively how dark is each band?).
Hint
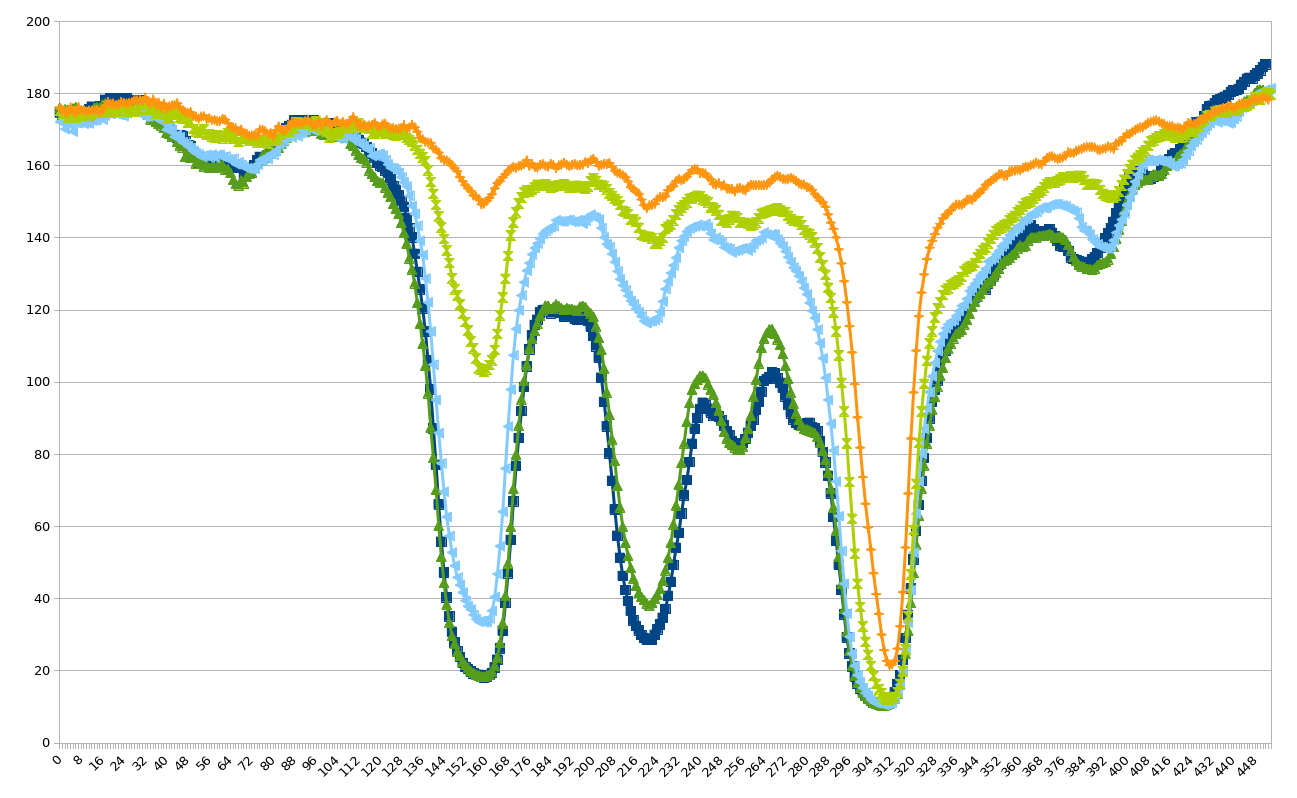
One approach to this might be to try and replace the 2d image with a sequence of 1d data (as each “lane” corresponds to roughly 1d information). In that case you should, as an intermediate output generate a plot similar to (but hopefully better than!) the following
 ]
]
If you have other ideas for how to tackle this problem, please feel free to experiment and compare!
Download the image from here.
Try and come up with a processing workflow that let’s you
Note
Some of this is beyond the scope of ImageJ and you will need to use e.g. Excel to generate the corrlation
analysis.
This exercise, to some extents, shows us some of the limitations of ImageJ, compared with a framework with larger scope, i.e. which could also be used to perform these analyses, such as Matlab or Python.
If you need more exercises please ask a demonstrator to help you determine which types of data might be best for you, especially with regards to being similar to the type of data you are intending to analyse.